
Client ROI, unredacted.
Every number below is pulled from live campaign dashboards. CAC deltas, conversion lifts, and budget efficiency ratios — rendered as-is, not reconstructed for presentation.



Before and after, by the numbers
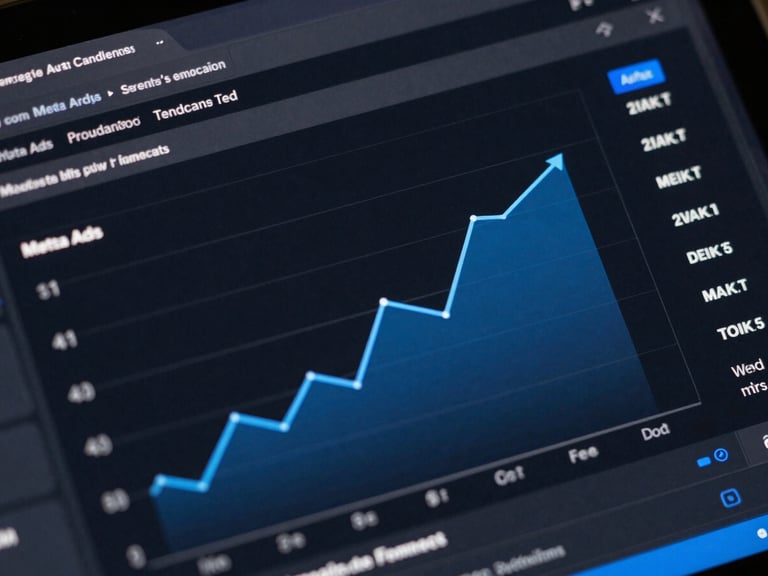
CAC cut 41% in 90 days
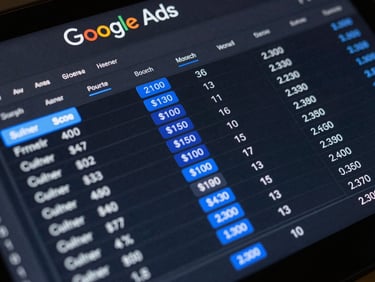
Trial signups up 58%
DTC apparel brand running $80K/mo in Meta spend. We restructured audience segmentation and automated creative rotation. CAC dropped from $38 to $22. ROAS moved from 2.1x to 3.7x.
B2B SaaS tool with $30K/mo Google budget. Rebuilt keyword architecture and layered ML bid strategies. CPL fell 34%. Trial-to-paid conversion improved by 22 points.
Revenue per send up 3.2x
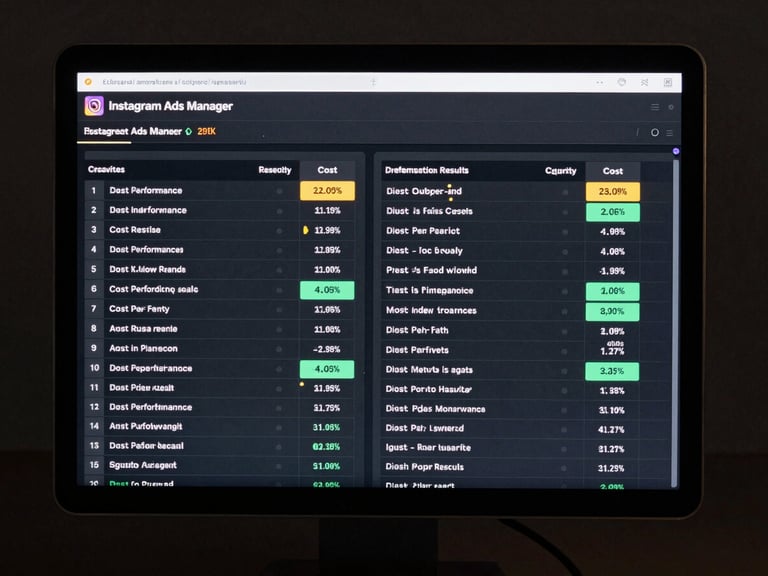
Install CAC halved in 60 days
Home goods retailer with 180K list. Rebuilt segmentation logic and automated behavioral triggers. Revenue per send grew from $0.31 to $0.99. Unsubscribe rate unchanged.
Mobile fitness app spending $45K/mo on Instagram. We ran 48-hour creative tests across six audience cohorts. Install CAC fell from $6.80 to $3.40. Retention at day-7 held flat.
Aggregate performance across all active accounts
−38%
3.4x
₹10L
100%
Of active clients have monthly performance reports with raw campaign data attached — no summaries-only dashboards.
Average CAC reduction across Meta and Google accounts after 90 days under management.
Median ROAS lift across e-commerce clients in the first full quarter after onboarding.
Recovered ad budget reallocated from underperforming placements to high-converting segments.
Seen enough? Let's look at your numbers.
Bring your current CAC, ROAS, and monthly ad spend. We'll show you where the budget is leaking before you commit to anything.